The Magic of Development Tools in Chrome & Safari
Table of Contents
As a web designer or developer, I’m sure you will agree that web browsers have come a long way from the Netscape and Internet Explorer days.
Along with the evolution of the web browsers was the technology to create and develop not only websites but applications.
Luckily, debugging and solving issues have become much easier with the help of browser development tools.
In this post, I will be going through some of the most common options in the development tools for both Chrome and Safari as they have the most market share according to statcounter.
But before we get started with the development tools, do you know where to find it?
Chrome development tools
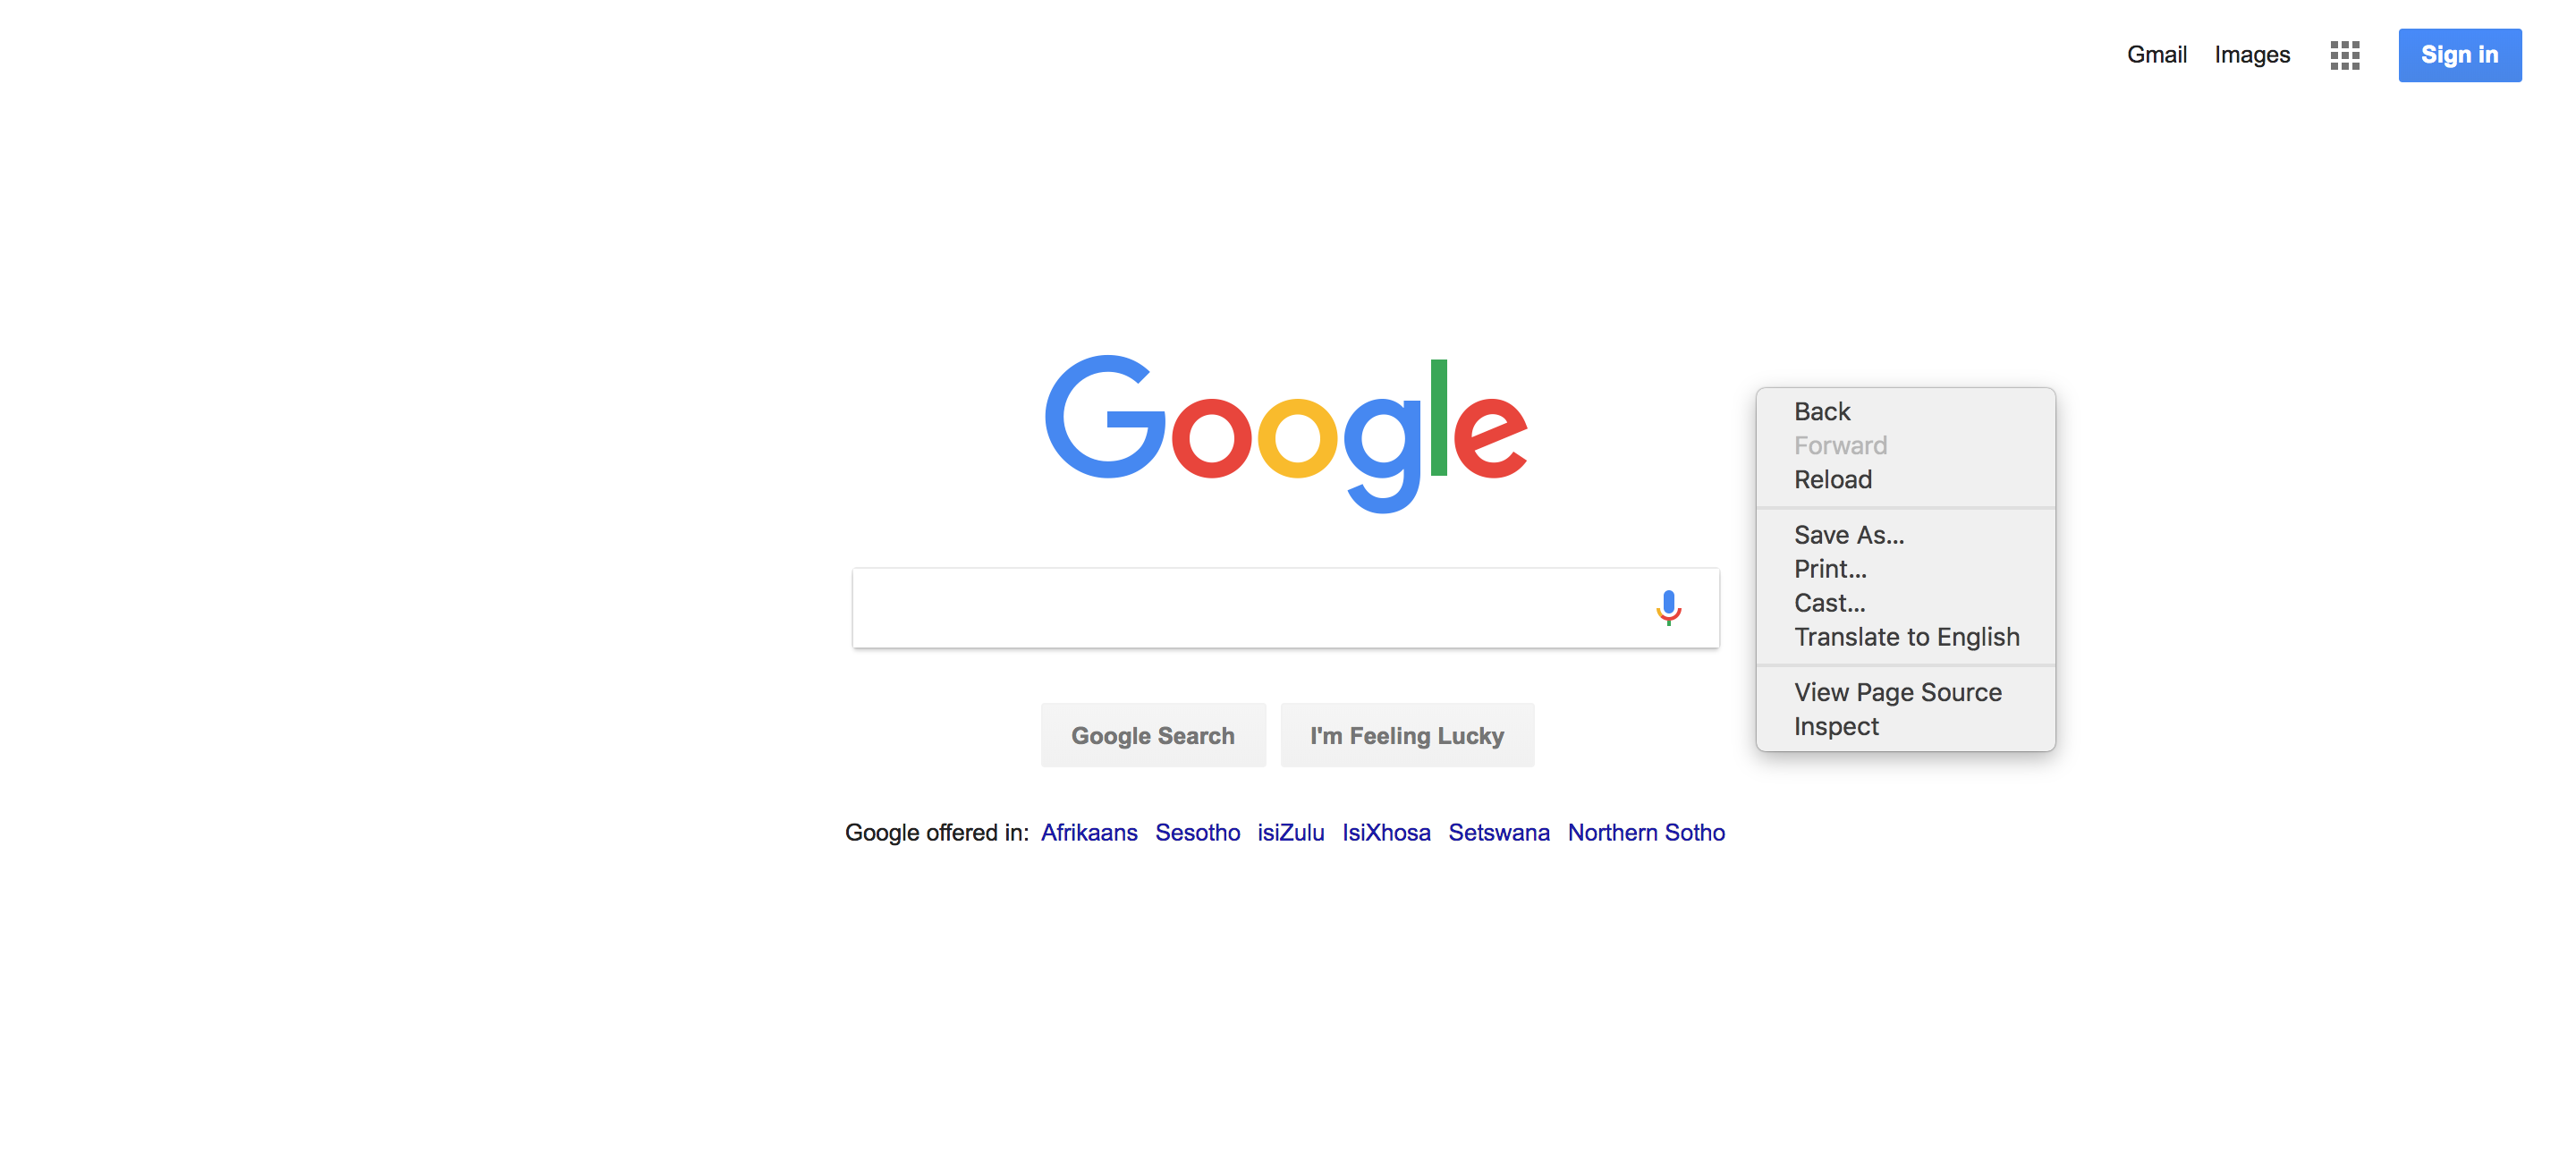
Right-click anywhere on the page you are viewing and click Inspect.
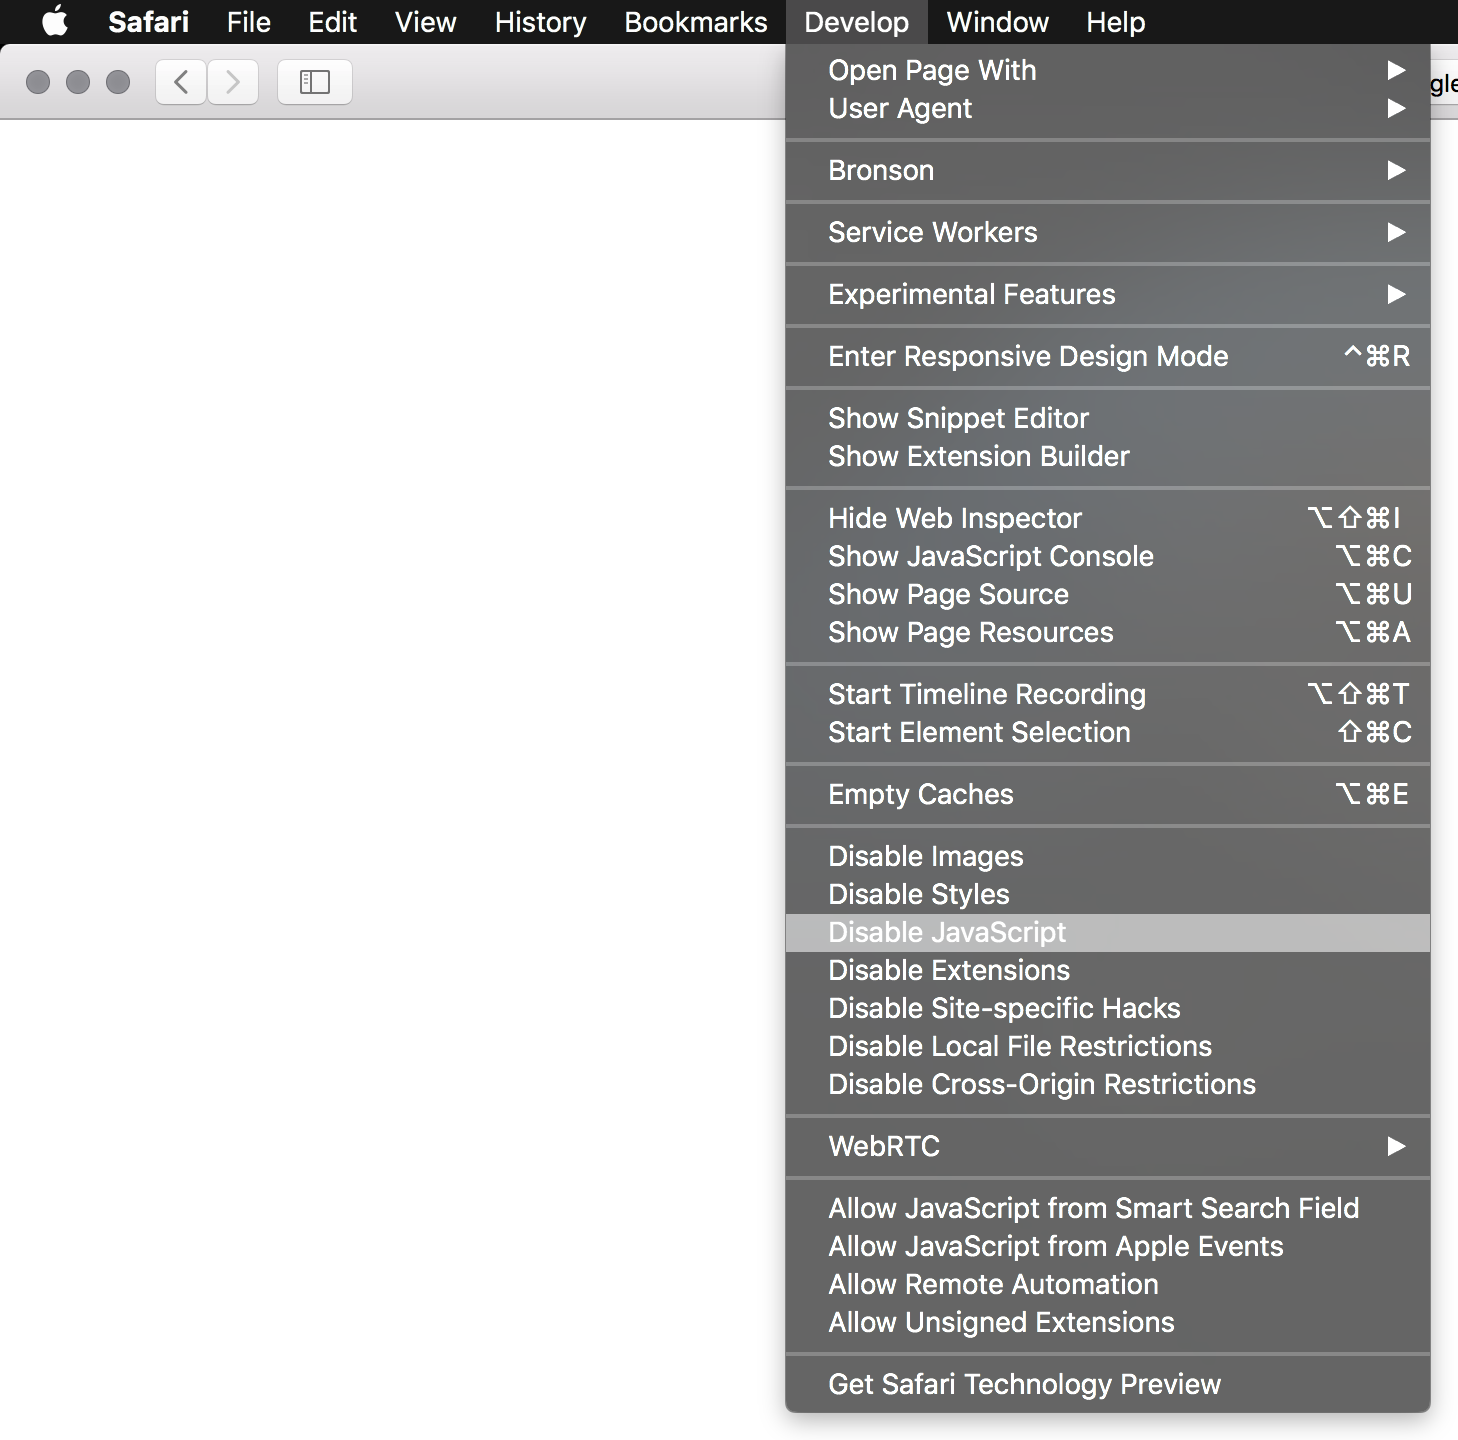
Safari development tools
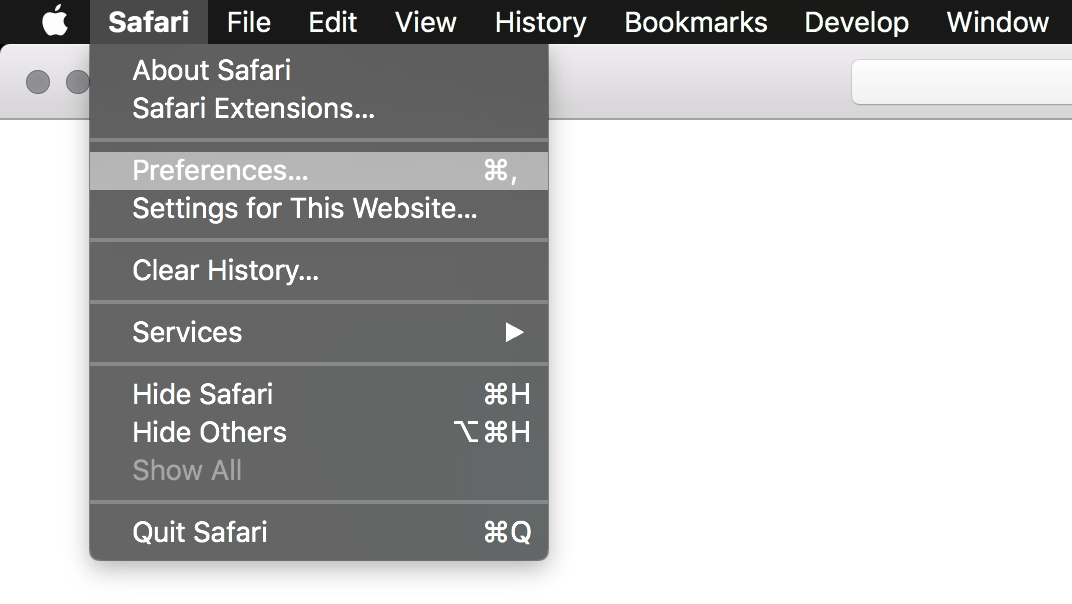
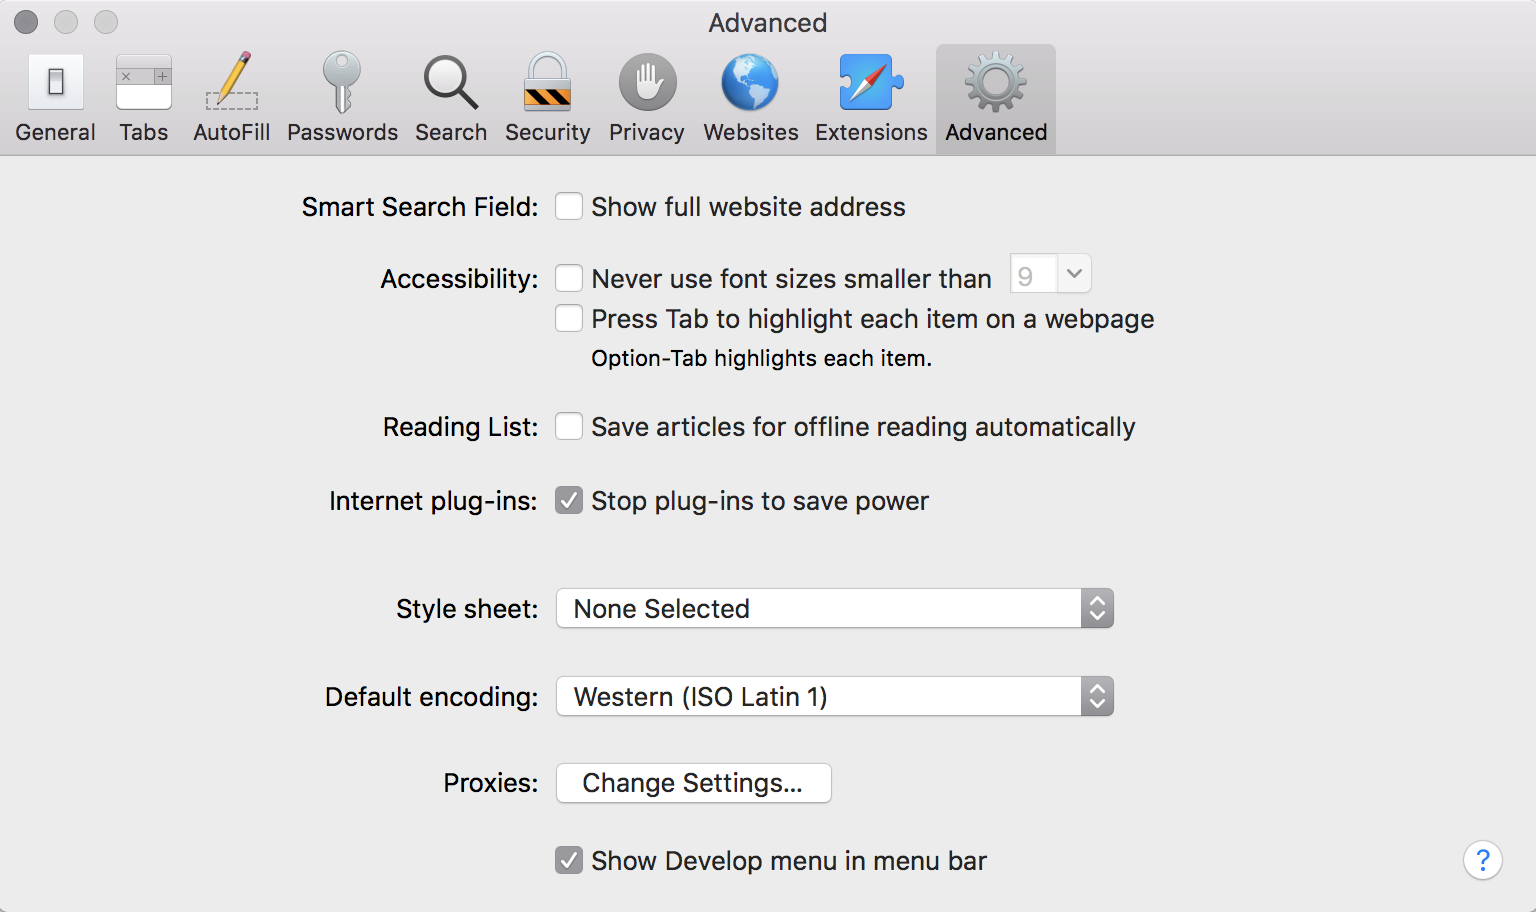
With Safari, you will need to enable the Develop menu by going to Preferences > Advanced.
Enable the option Show Develop menu in menu bar.
Now you will be able to right click and Inspect.
You can also change the position of your development tools.
In Chrome you can dock your development tools to the right, left or bottom of the window.
You can also have it as a separate window.
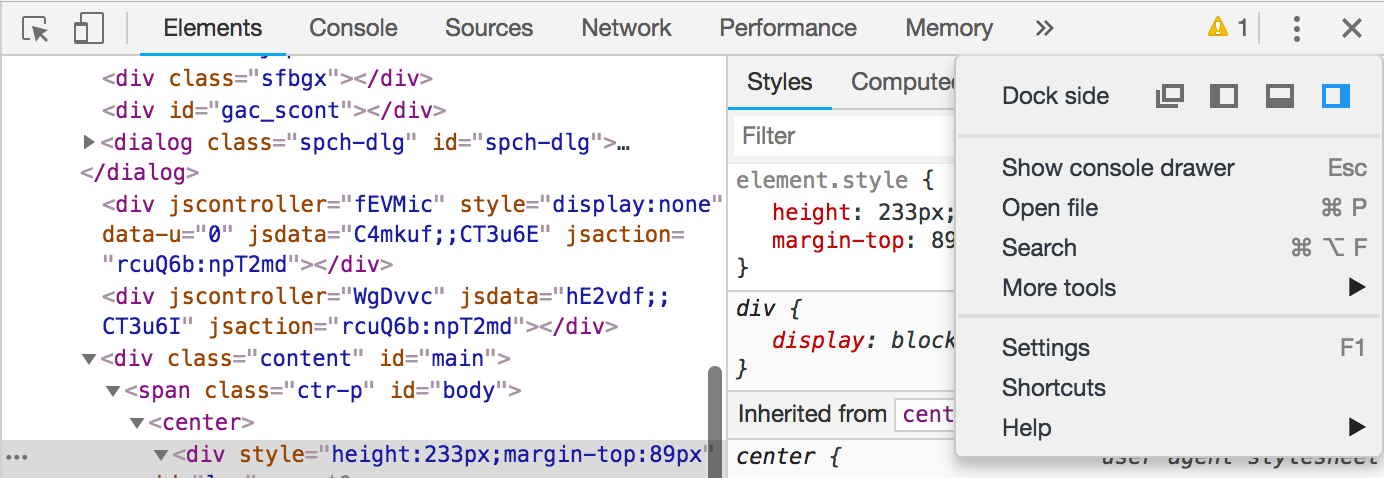
To change the position of your development tools, click on the vertical ellipsis at the top right of the window.
With Safari you can dock your development tools at the bottom or right of the window.

To change the position, click on the appropriate buttons at the top left of the window.
You also have the option of having it as a separate window.
With your development tools ready, let’s get started…
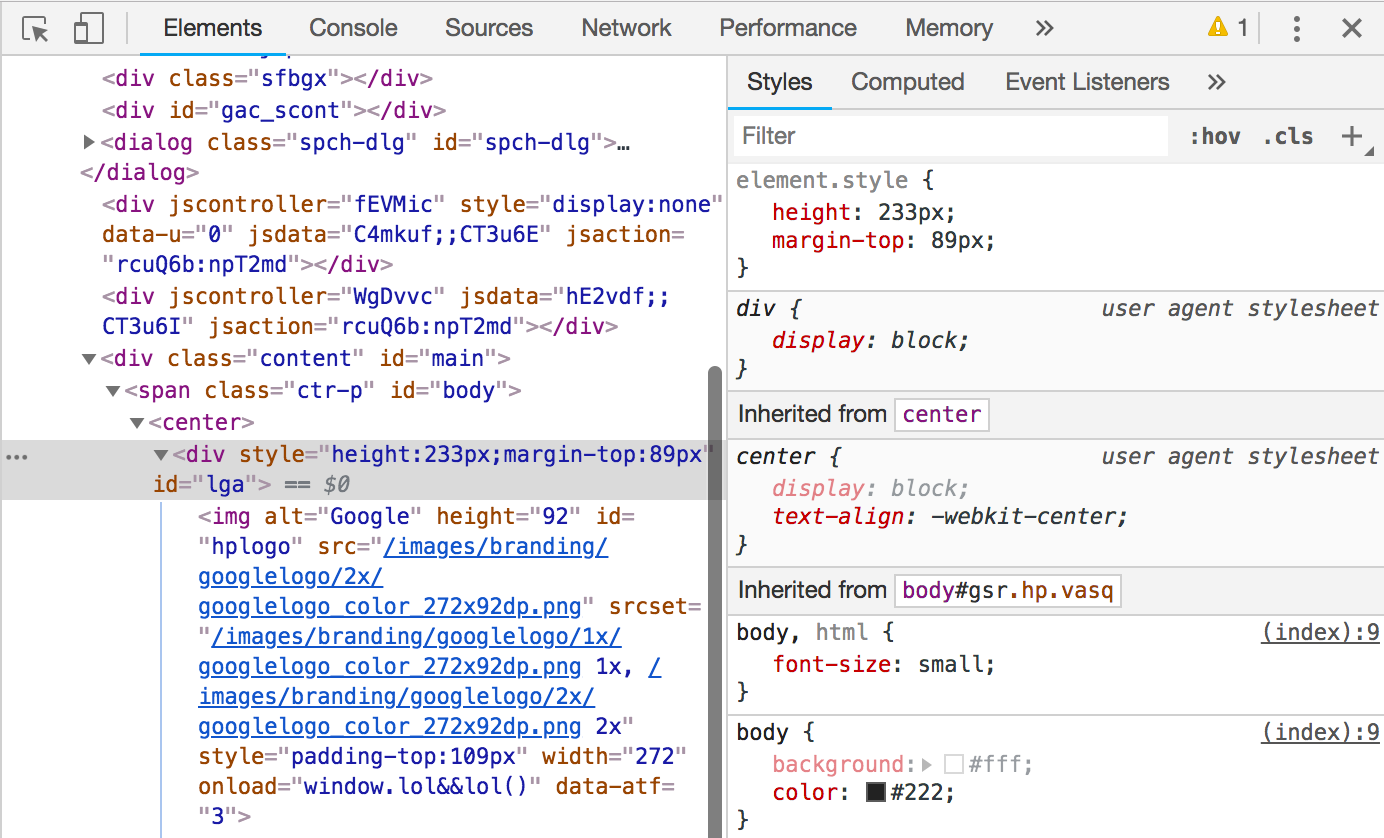
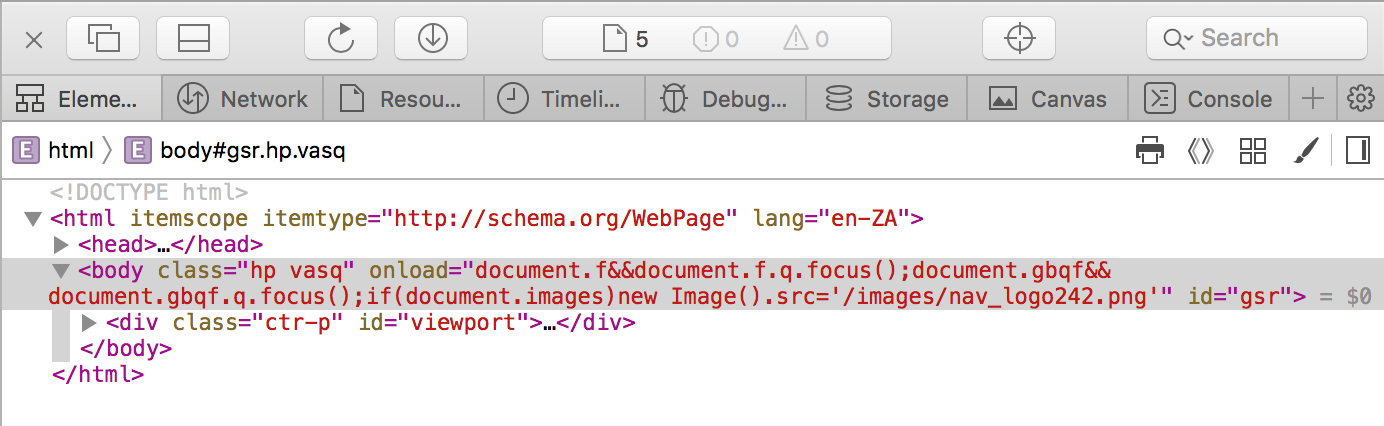
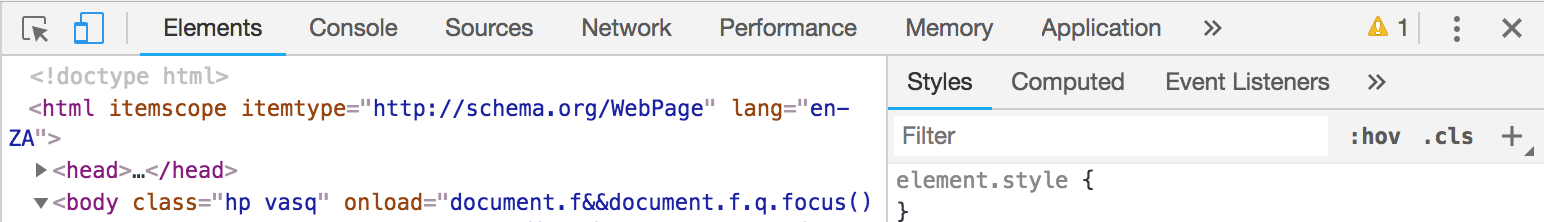
Elements
In both Chrome and Safari, Elements is the first option in your developer tools.
Sometimes as a web designer or developer, you need to test theory to see if it will solve the problem.
Instead of the making the changes to the code, saving and then waiting for the changes to show in the browser, we can use the Elements tab in the development tools.
By default, the Elements tab has two panes in Chrome.
In one, you have the HTML of the page you are viewing and in the other, you have the CSS for the selected element.
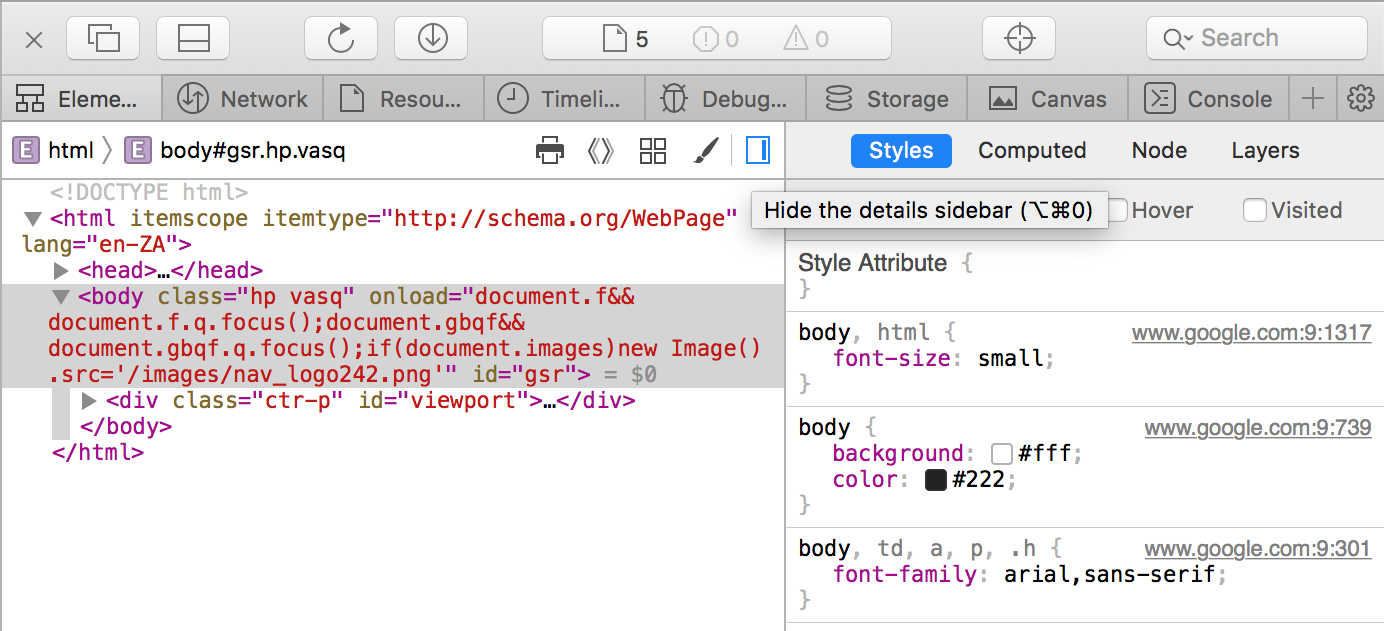
In Safari, by default, you will only see the HTML.
To see the CSS as well, click on the Show the details sidebar button.
In the HTML panel you can do any of the following by right clicking on an element:
- Add/edit attributes
- Edit element as HTML
- Delete element
- Copy element
- Hide element
- Force states
In the CSS panel you can:
- Identify what styles are being applied by the browser and style sheets
- Change CSS properties
- Add inspector style rules
- Force different states
Console
In Chrome, the second option is your Console.
With Safari you will find your Console as the last option.
The all famous Console.
If you’ve been a web designer or developer for some time, you will be well aware of the Console, or perhaps more famously the console.log.
The Console will show you if there are any errors on the page you are viewing, such as scripts or resources that are not found and return a 404 status message.
But the Console can also be helpful with debugging by using the console.log function.
For example, if you are not sure what the value of a variable is or what response is being returned, you can use the console.log function.
If you don’t want to use console.log, you can type directly in the Console.
This is only useful if you need to test something quickly and can’t be used for elaborate scripts.
Our trusty Console has come a long way and is an integral part of web design and development.
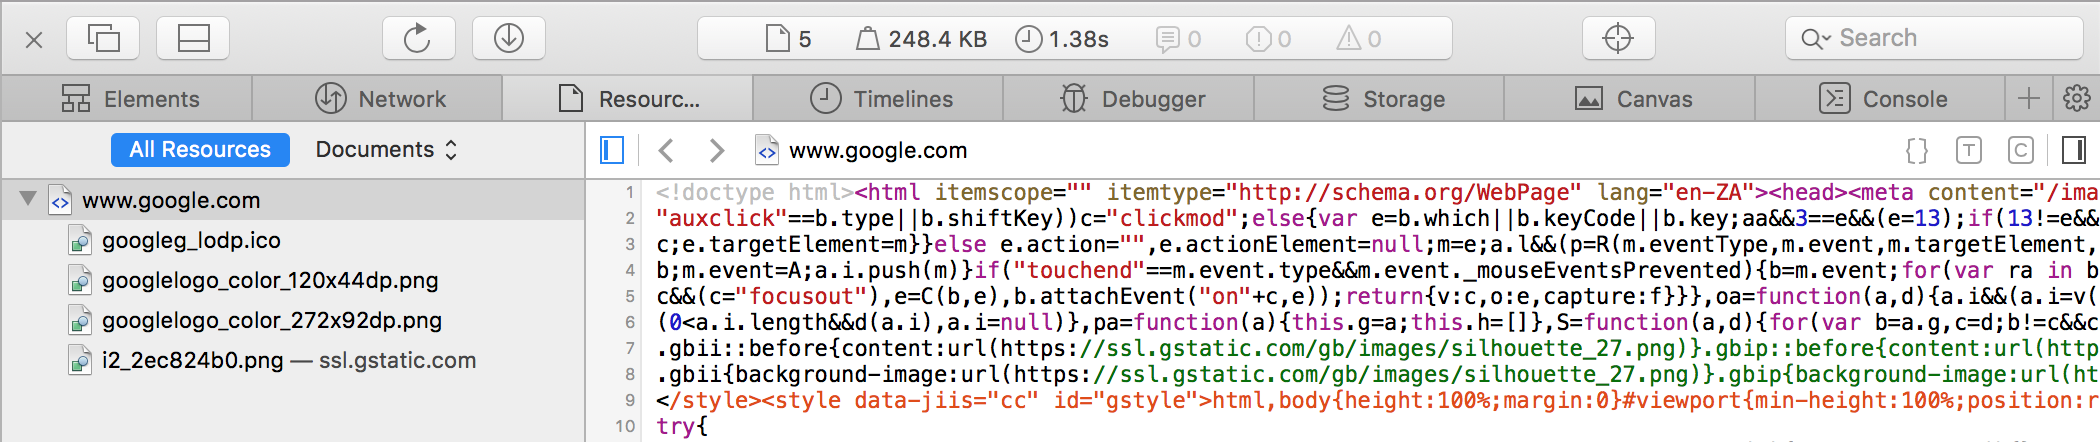
Sources (Chrome) / Resources (Safari)
In Chrome and Safari, you will find this as the third option in your development tools.
Here you will find all the assets that are being loaded such as Javascript, CSS, images, and fonts.
Network
In Chrome the fourth option is Network.
With Safari you will find it as the second option.
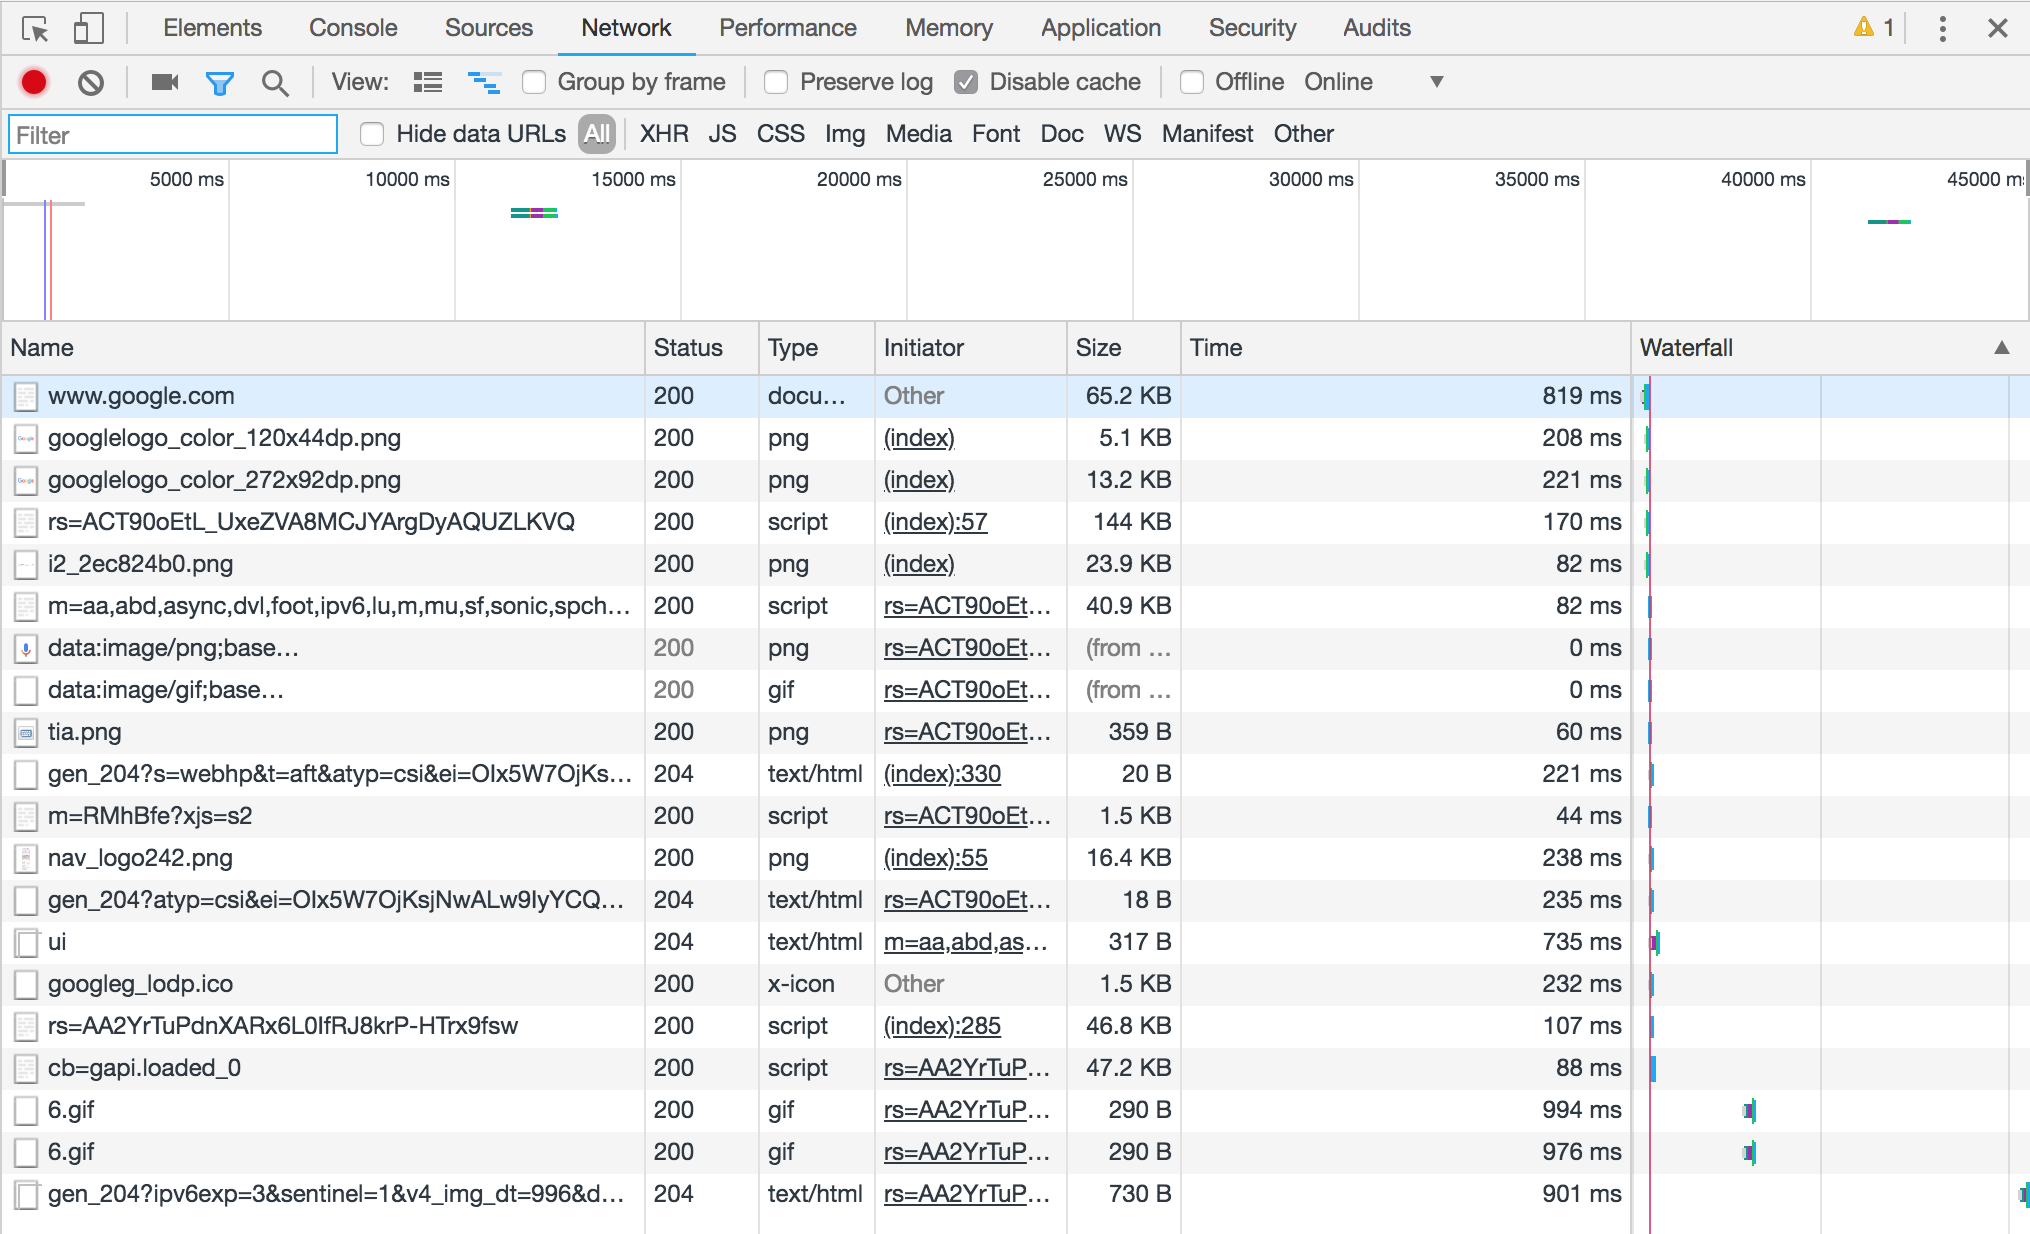
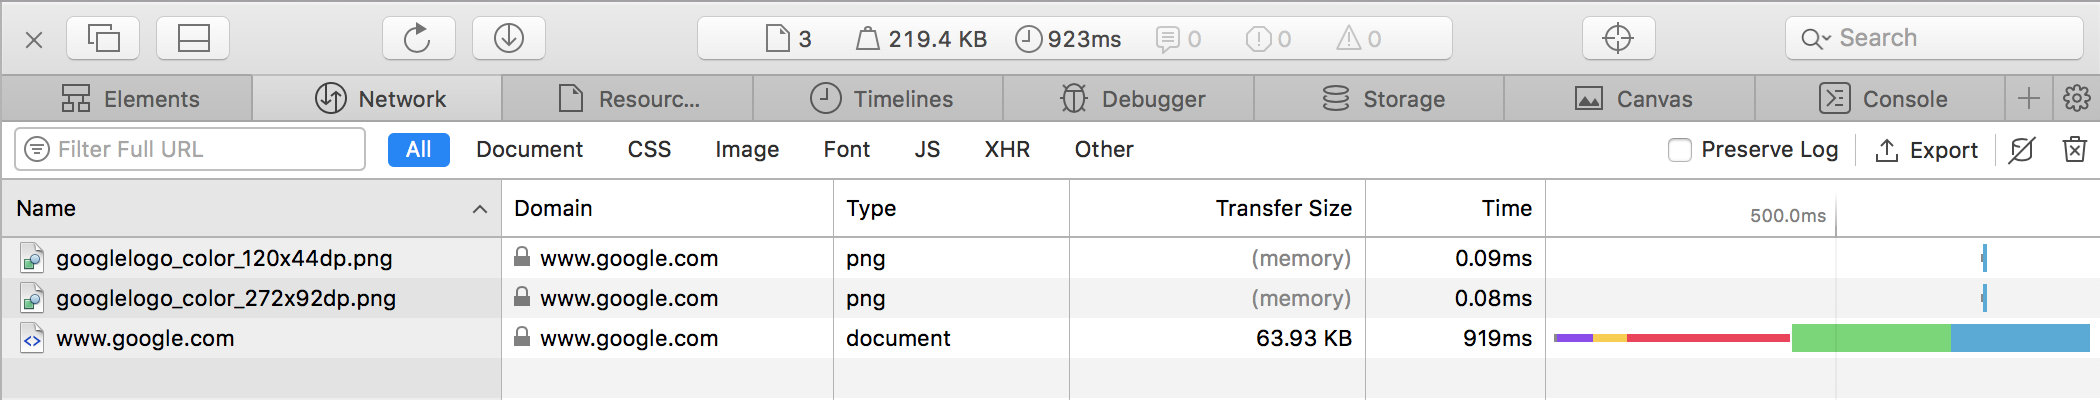
This option is similar to the previous one except it gives you more information.
To start with, it shows you how long it takes for the resources on a page to load in the Time column.
If you want to improve the loading speed of a page this is the perfect place to find what resources take the longest to load and whether they are needed for the page.
You can also filter the types of resources you want to see by clicking the relevant name or using the filter search.
With Chrome, you can block a resource from loading without changing the code here.
To block a resource, right click on it and select Block request URL.
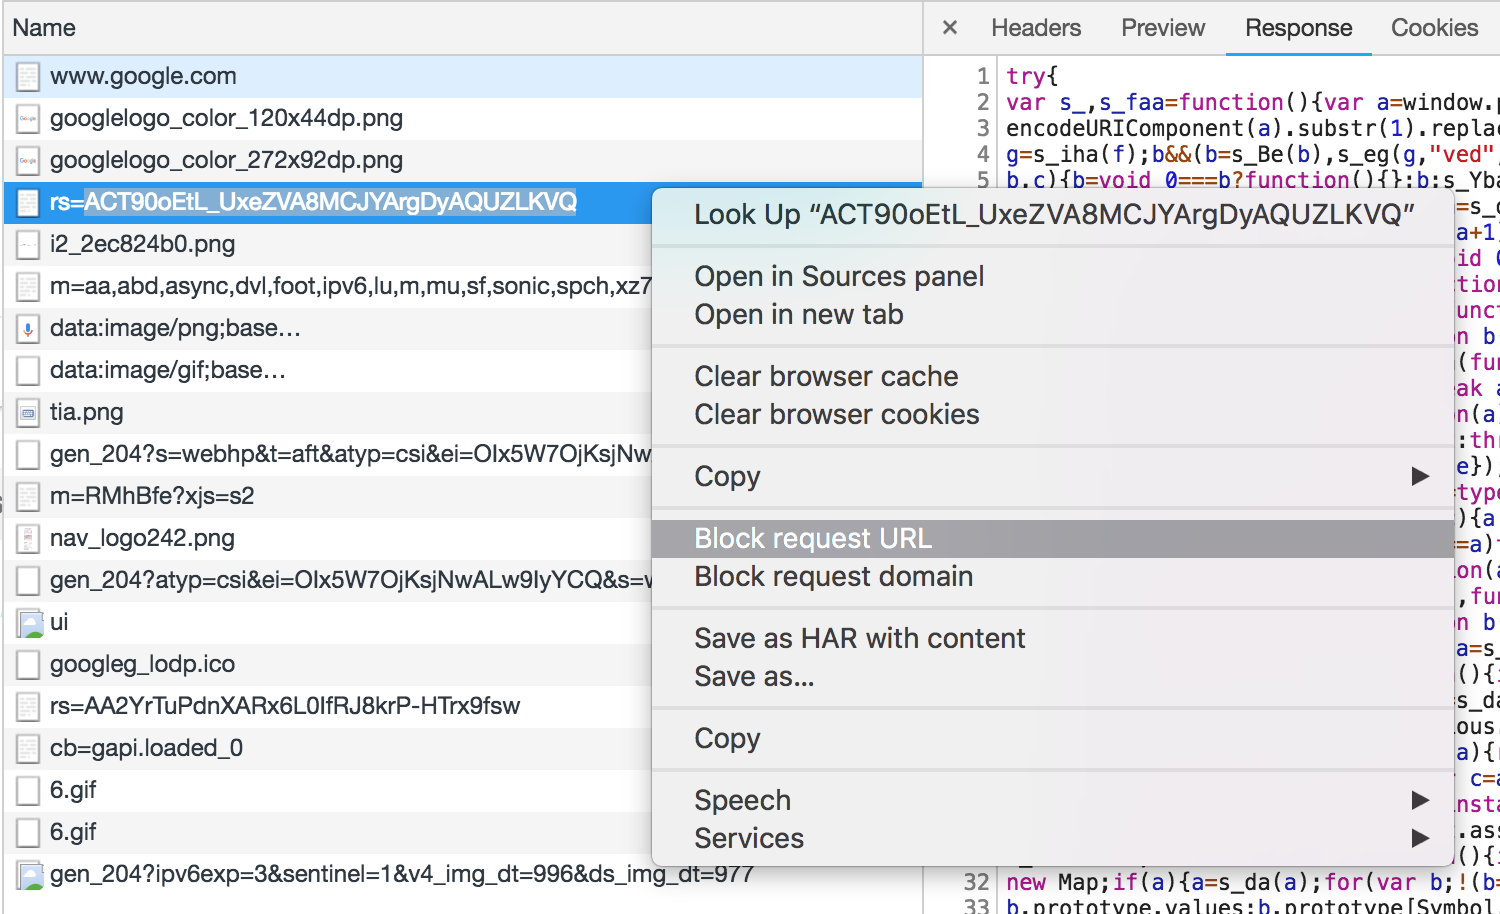
If you refresh the page now, the resource will not be loaded.
To unblock, just right click on the resource again and click Unblock …
With Safari, you can only disable certain types of resources from loading such as images, styles or Javascript
These options are available from the Develop menu option.
But wait, there is more.
If you are using API’s, you might want to see what data is being received or sent by the API.
Of course, you can do this using various other methods or utilities but sometimes it’s easier to just use the browser.
In the filter options, you will see an option called XHR.
This will filter any requests being made by the page such as API calls.
If you don’t see any requests here, you can try the Other option.
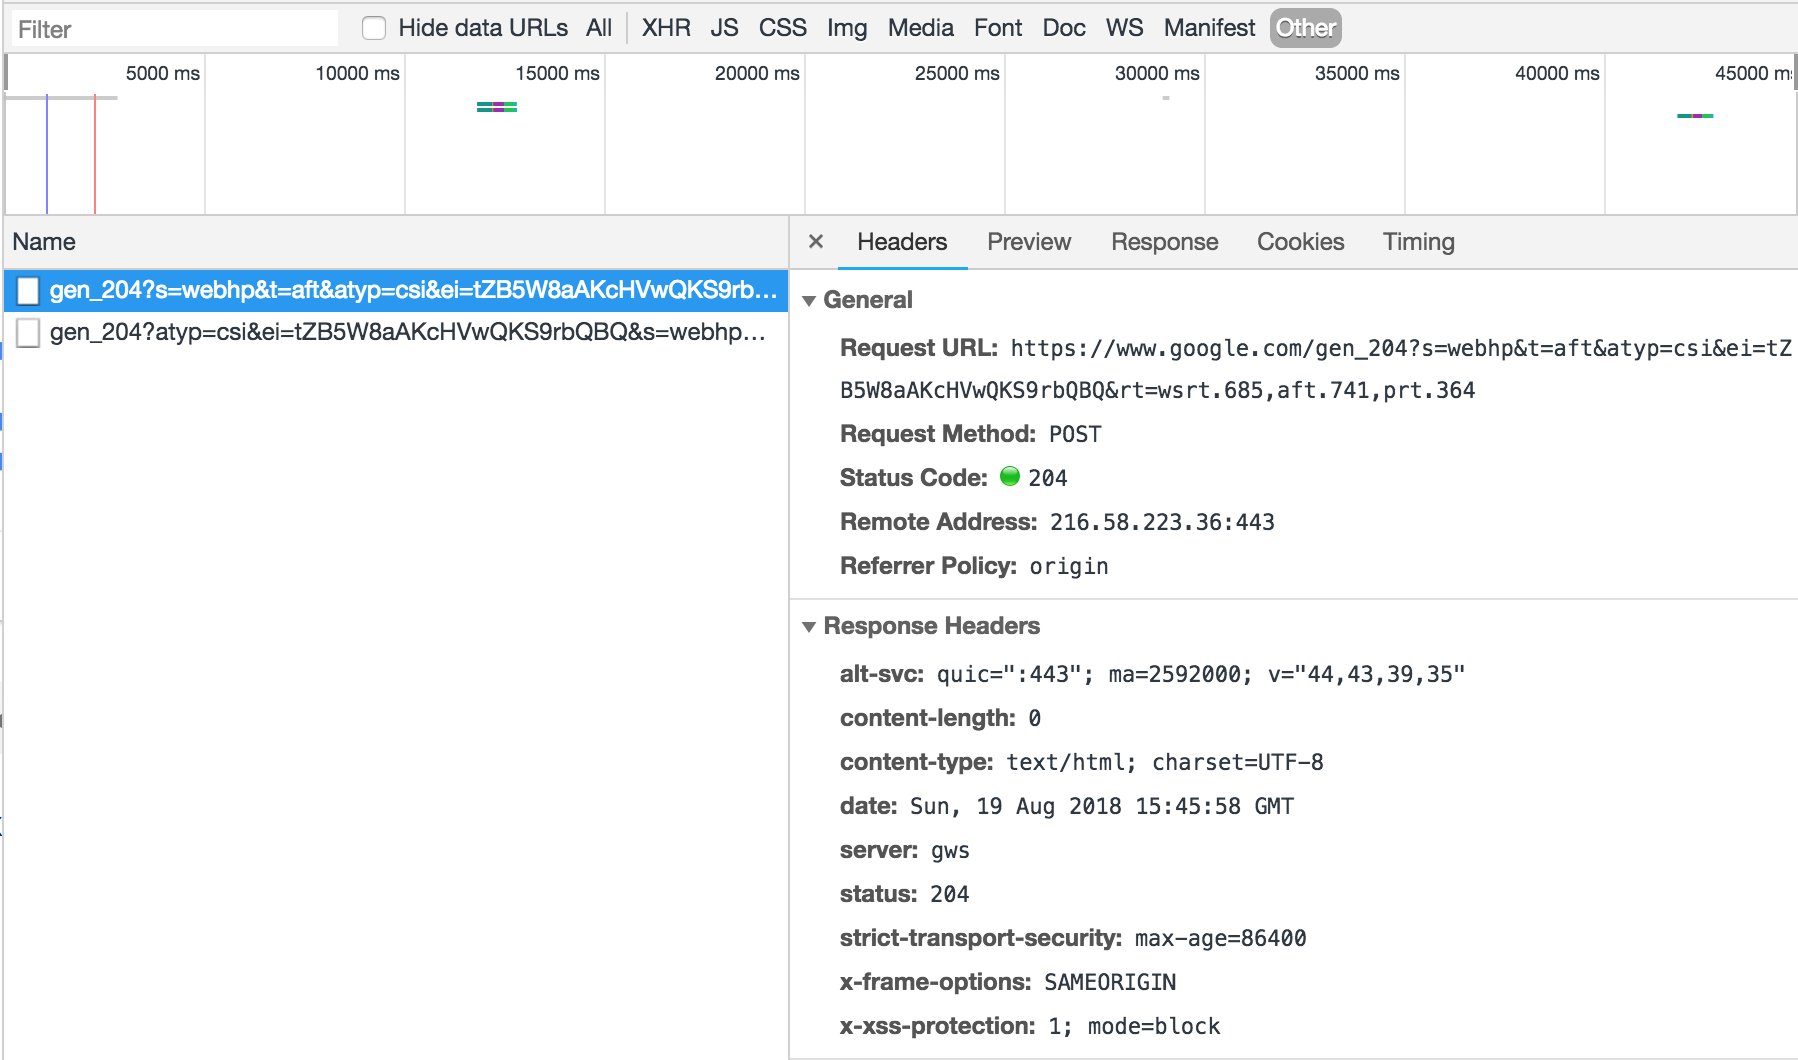
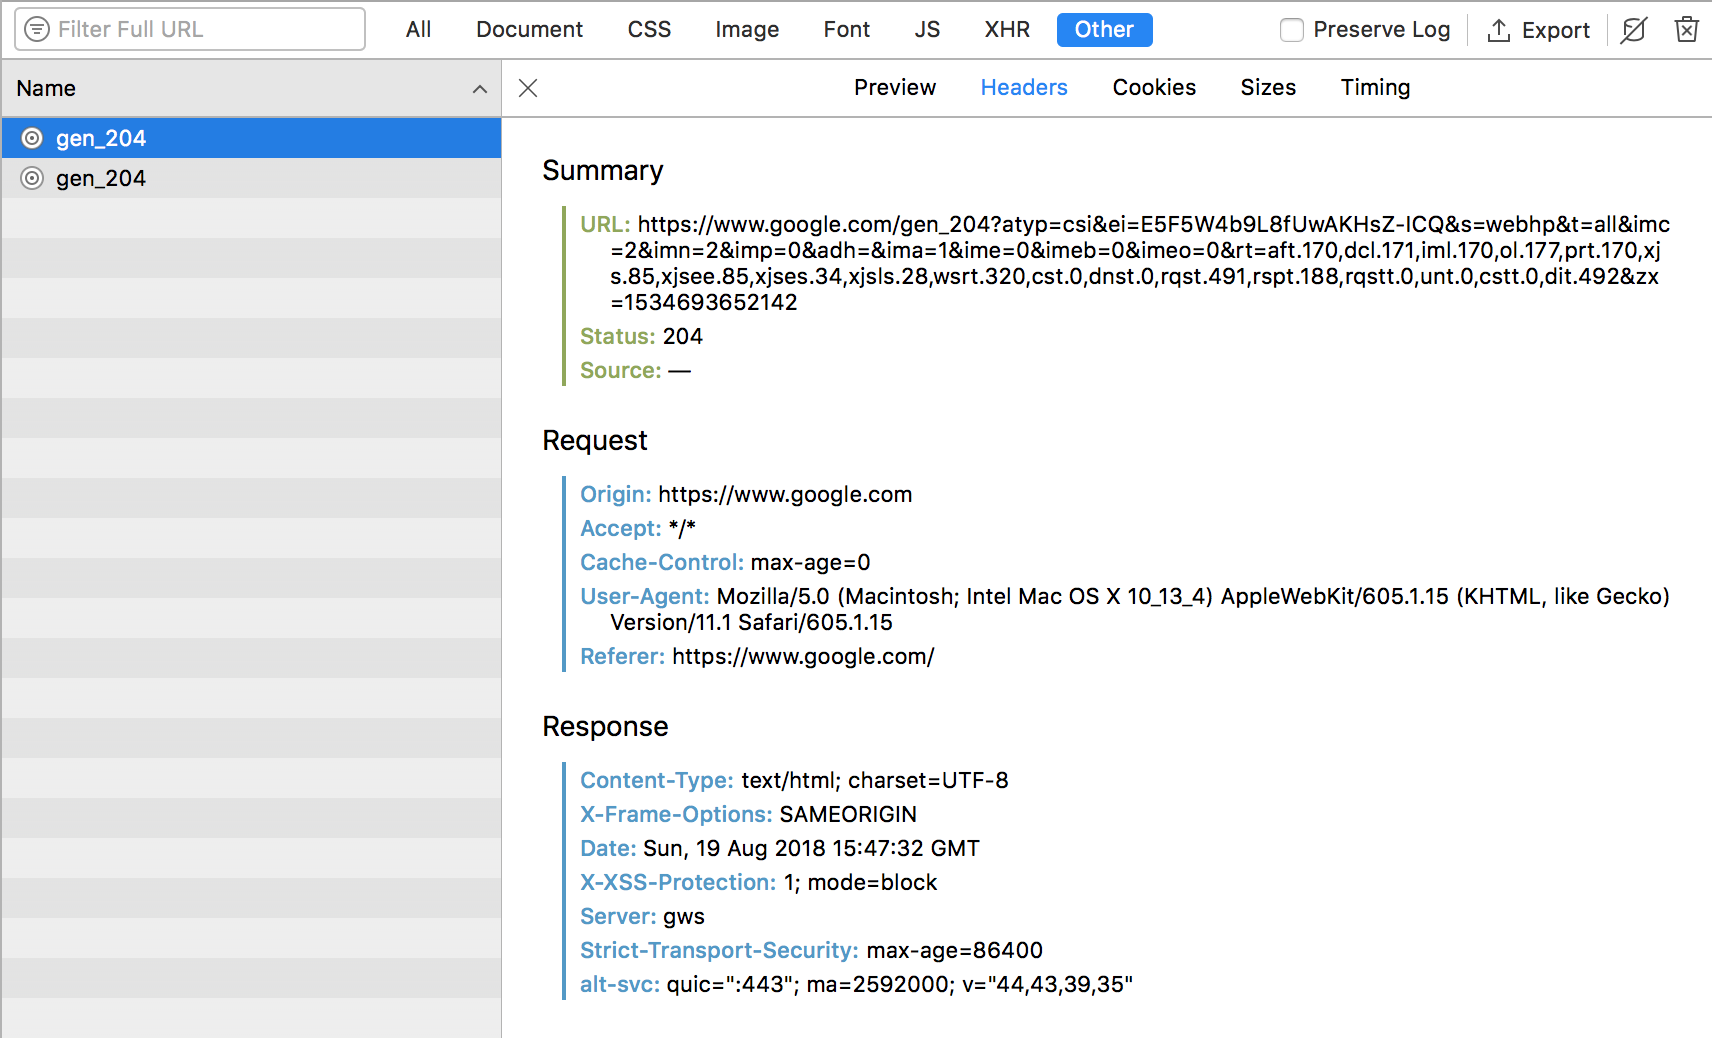
After selecting a filter option, it is always better to refresh the page for all the resources to load again.
With the filter option selected, you will be able to see from where the call is being made, in other words, the API URL.
If you click on the Name you will be able to see the details of the request being made such as the Headers, Preview, Response & Timing.
Safari also includes Cookies and Sizes.
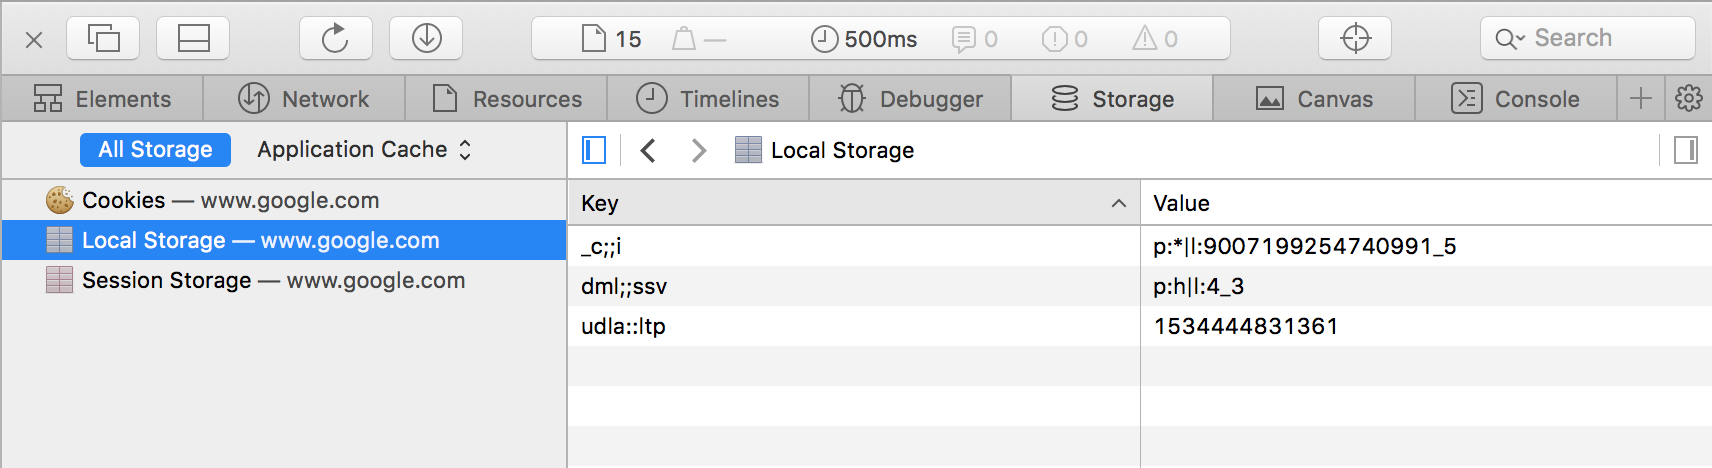
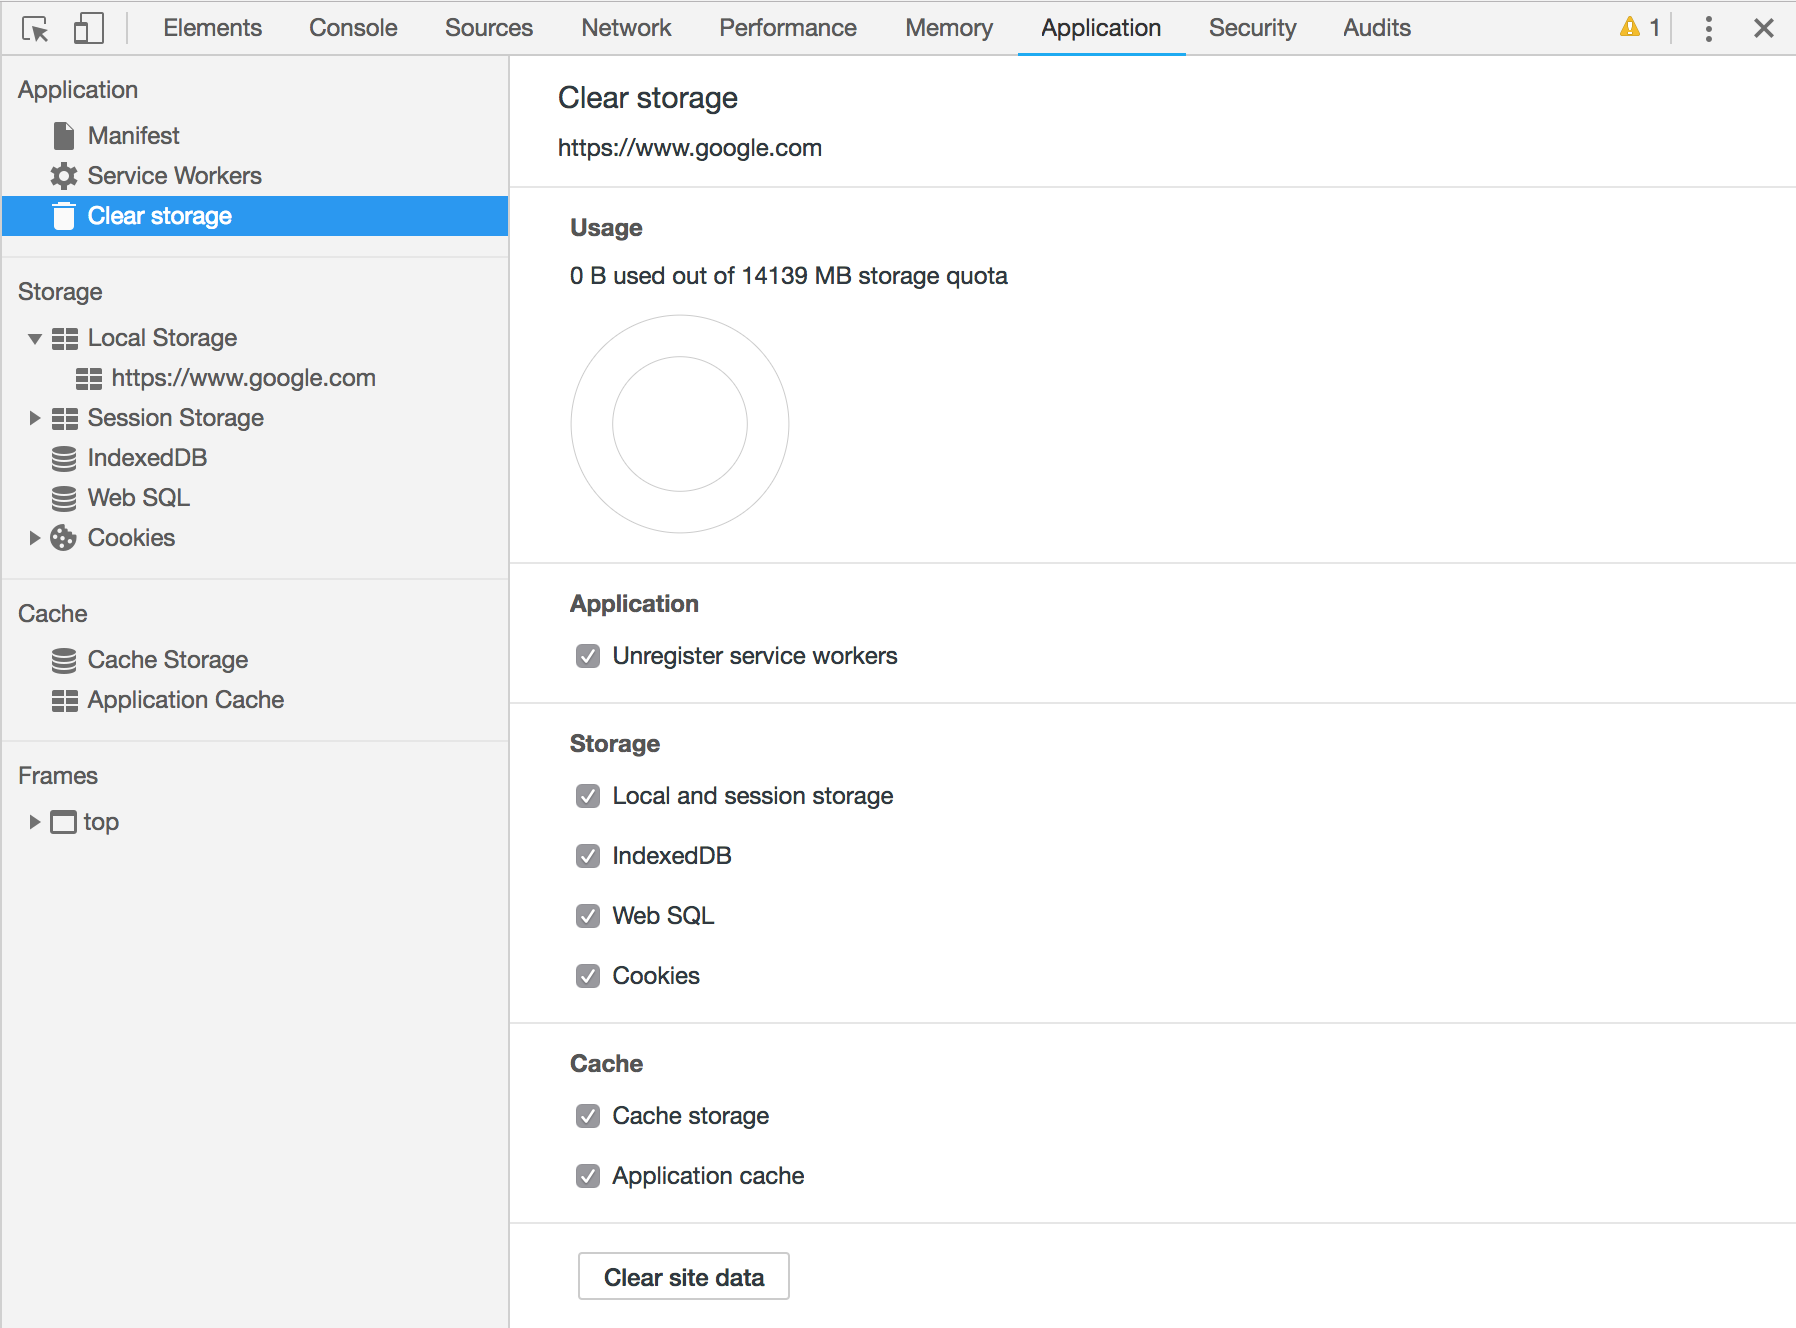
Application (Chrome) / Storage (Safari)
When creating websites or applications these days, chances are there will be things saved in the browser whether it is cached assets or cookies.
While developing you might need to clear this data to see changes you are making.
To see what is being saved in Chrome, you can go to the Application option.
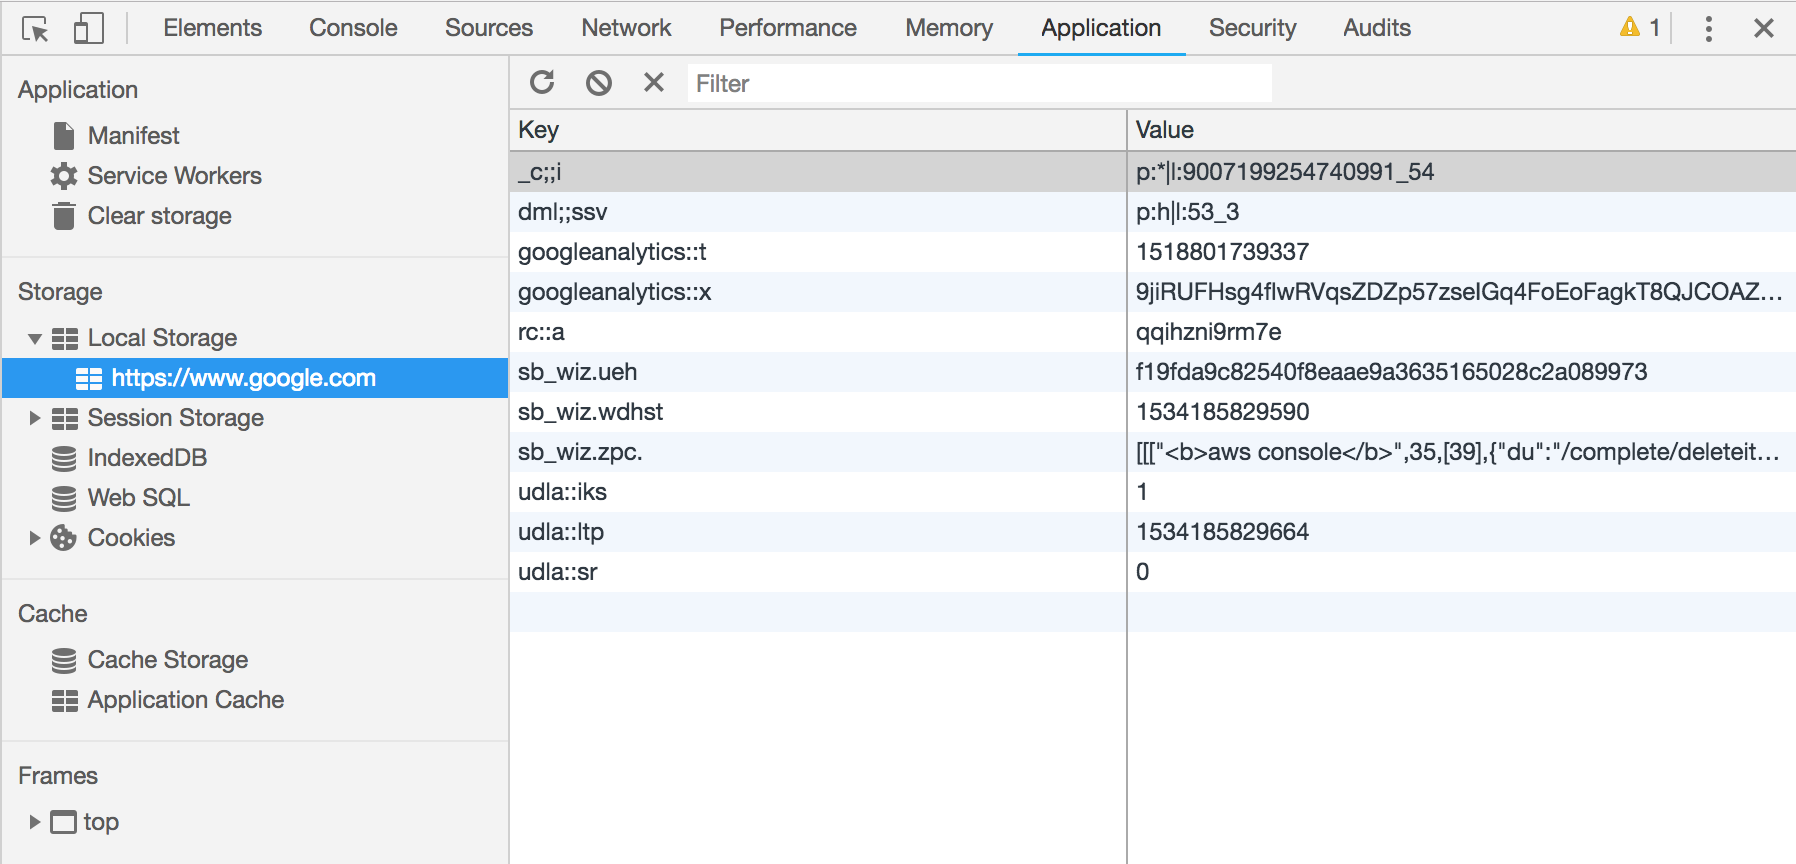
With Safari, you will find it under Storage.
 w
w
These options will show you the different types of data that is being saved such as Local Storage, Session Storage or Cookies.
In Chrome, to delete everything that has been saved, go to Clear storage and click on Clear site data.
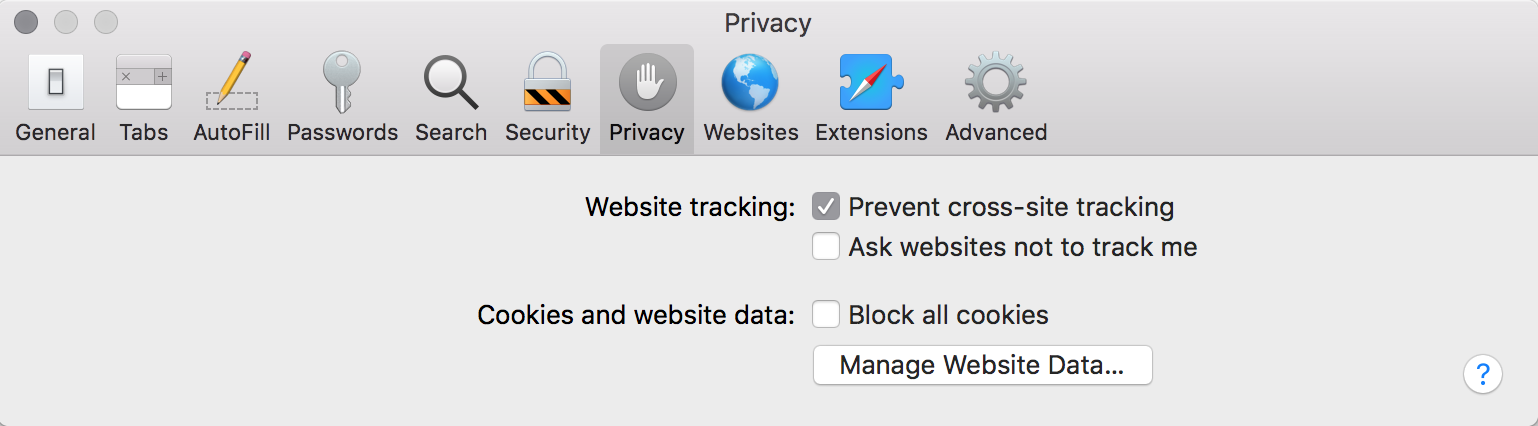
With Safari, you need to go to Safari > Preferences.
Select Privacy and then click on the Manage Website Data…
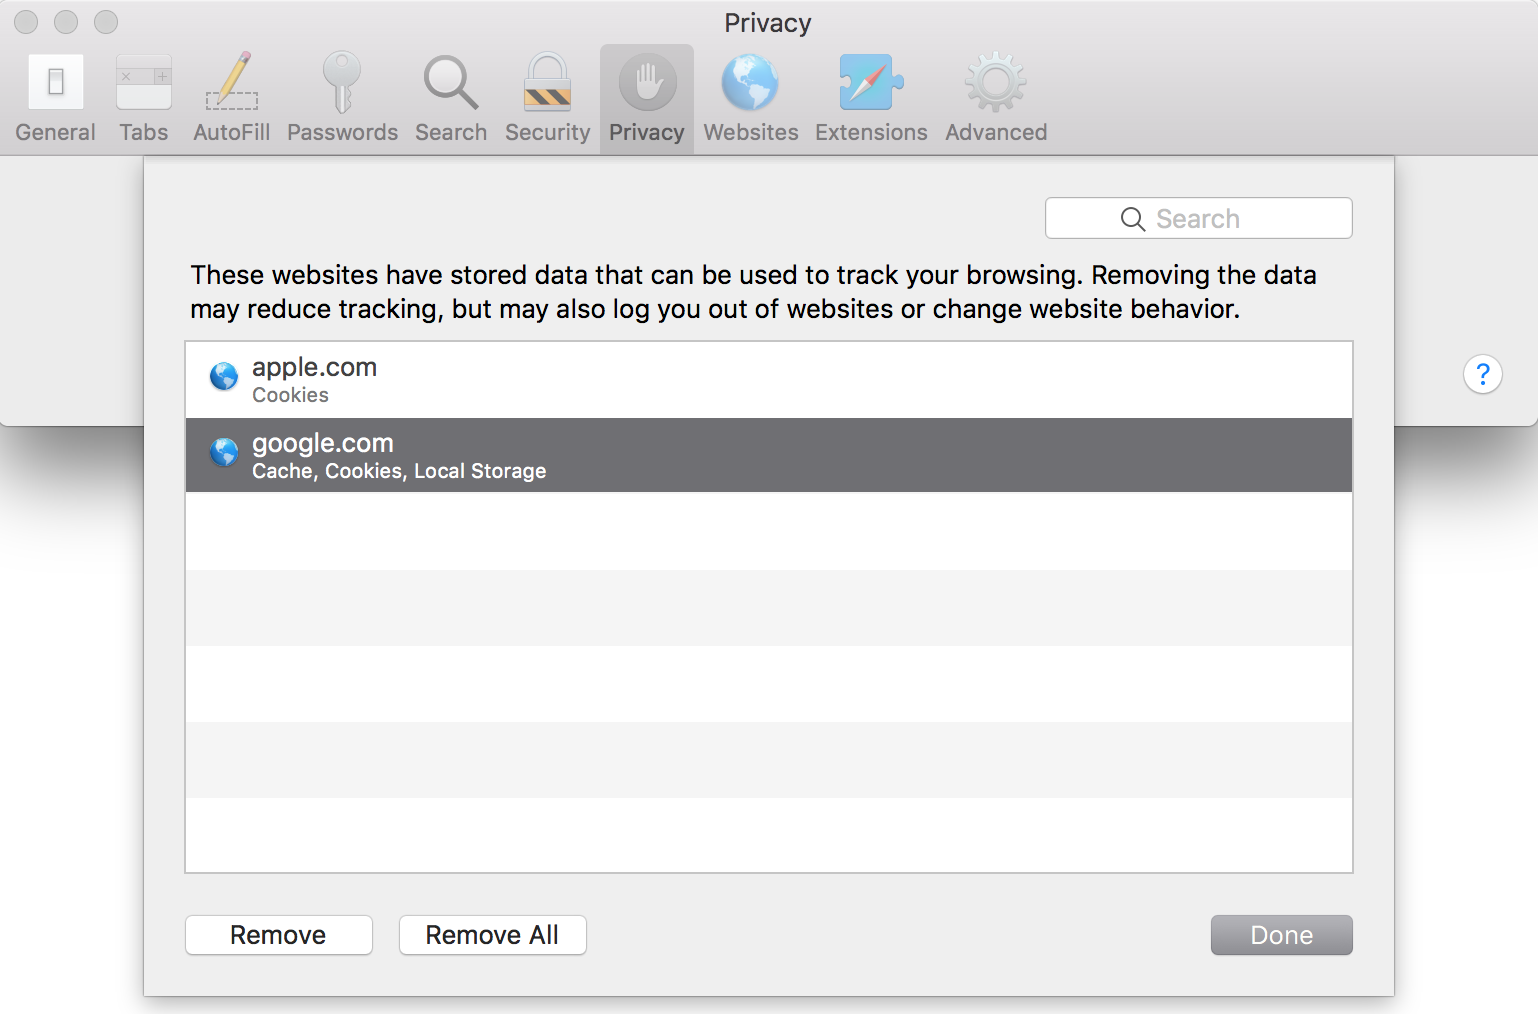
Here you will see all the websites that have saved data in the browser.
You can either click on Remove All of them or select a website and click Remove.
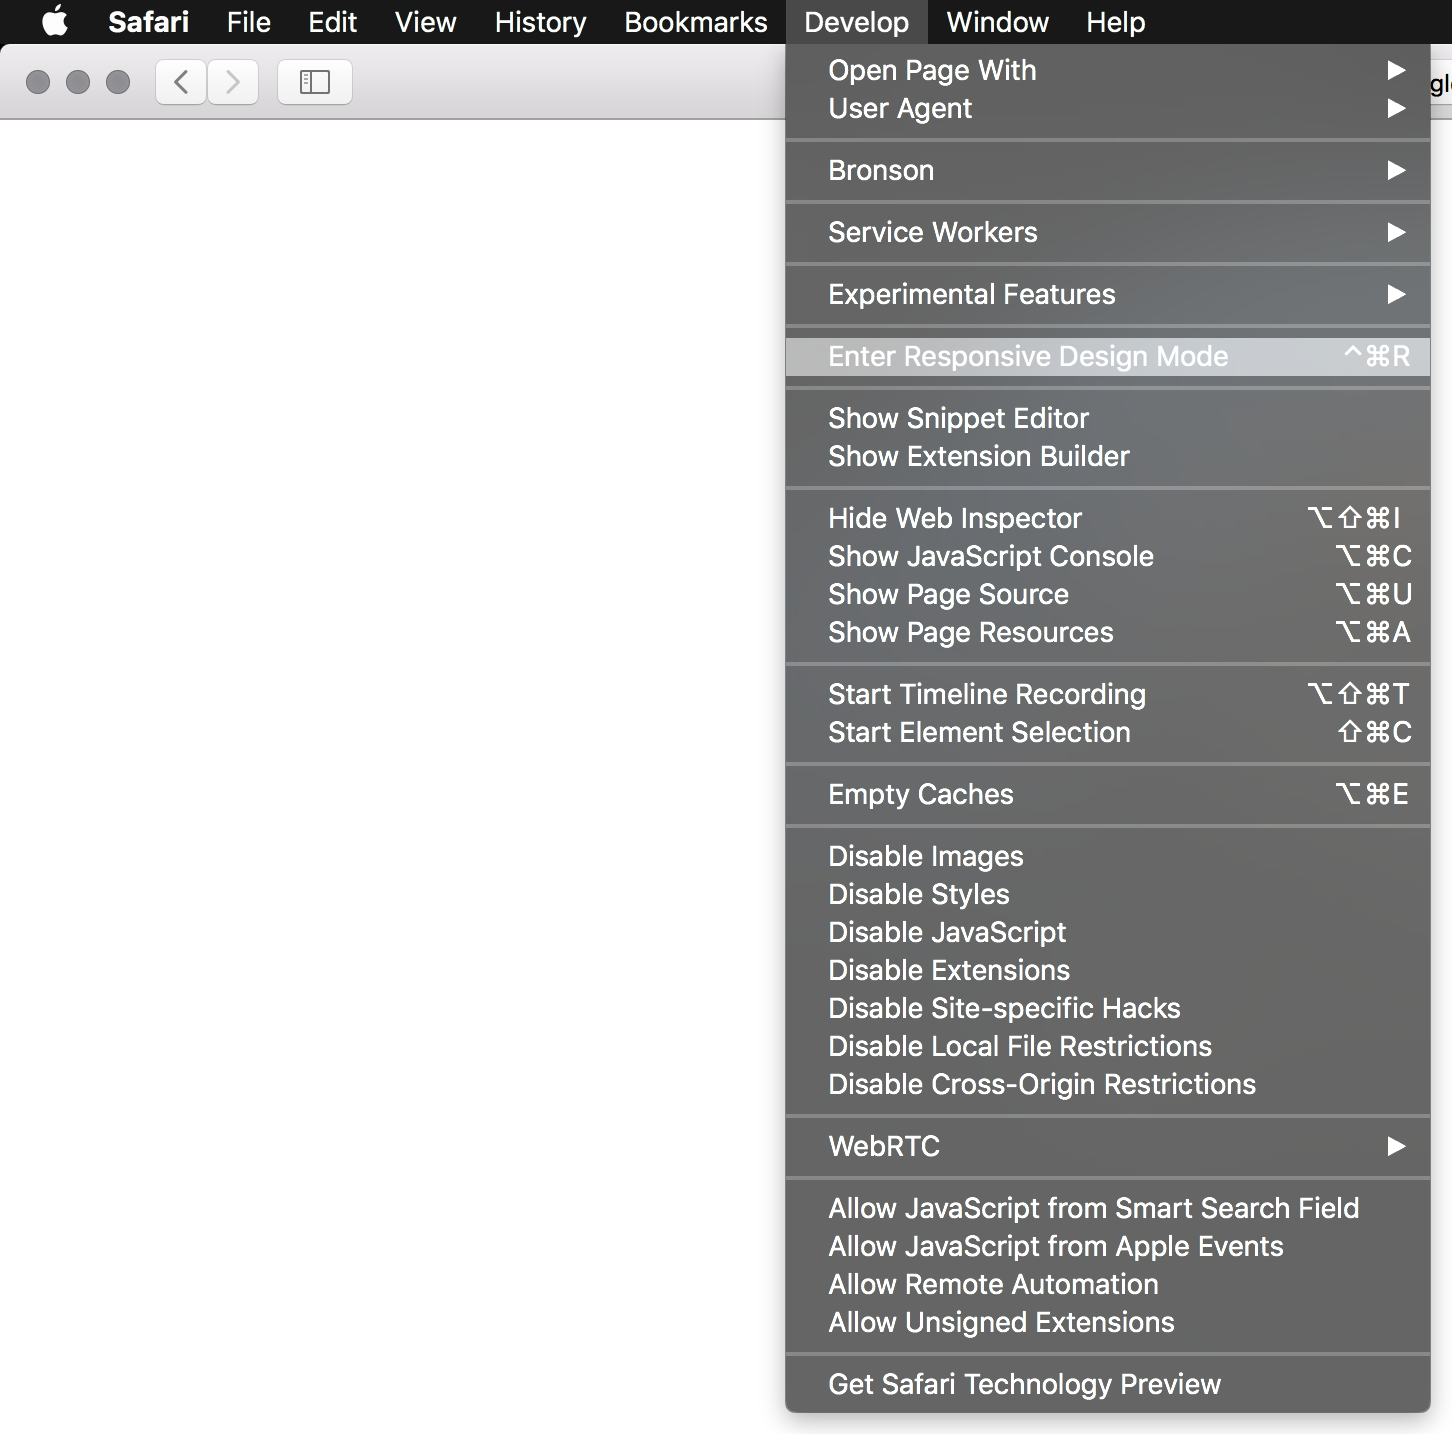
Device toolbar (Chrome) / Enter Responsive Mode (Safari)
Lastly, we come to responsive testing.
Creating a responsive website or application can be tricky even if you use a framework like Bootstrap.
You can either re-size your browser or you can use the built-in responsive tools.
In Chrome, you have the Device toolbar which you will find next to your Elements option.
After you click on it, you will see a number of options and toolbars appear around the page you are viewing.
With Safari, click on Develop > Enter Responsive Design Mode.
From here you can select various smartphone and tablet devices to see how the page you are viewing scales.
You also have the option of viewing the device in portrait or landscape.
I hope you enjoyed this post and found some value in it, if there any other resources you like to use please let me know in the comments!